Metrics latency and throughput are not collected in tests with one invocation #856
Description
After https://github.com/griddynamics/jagger/issues/844 has been fixed in
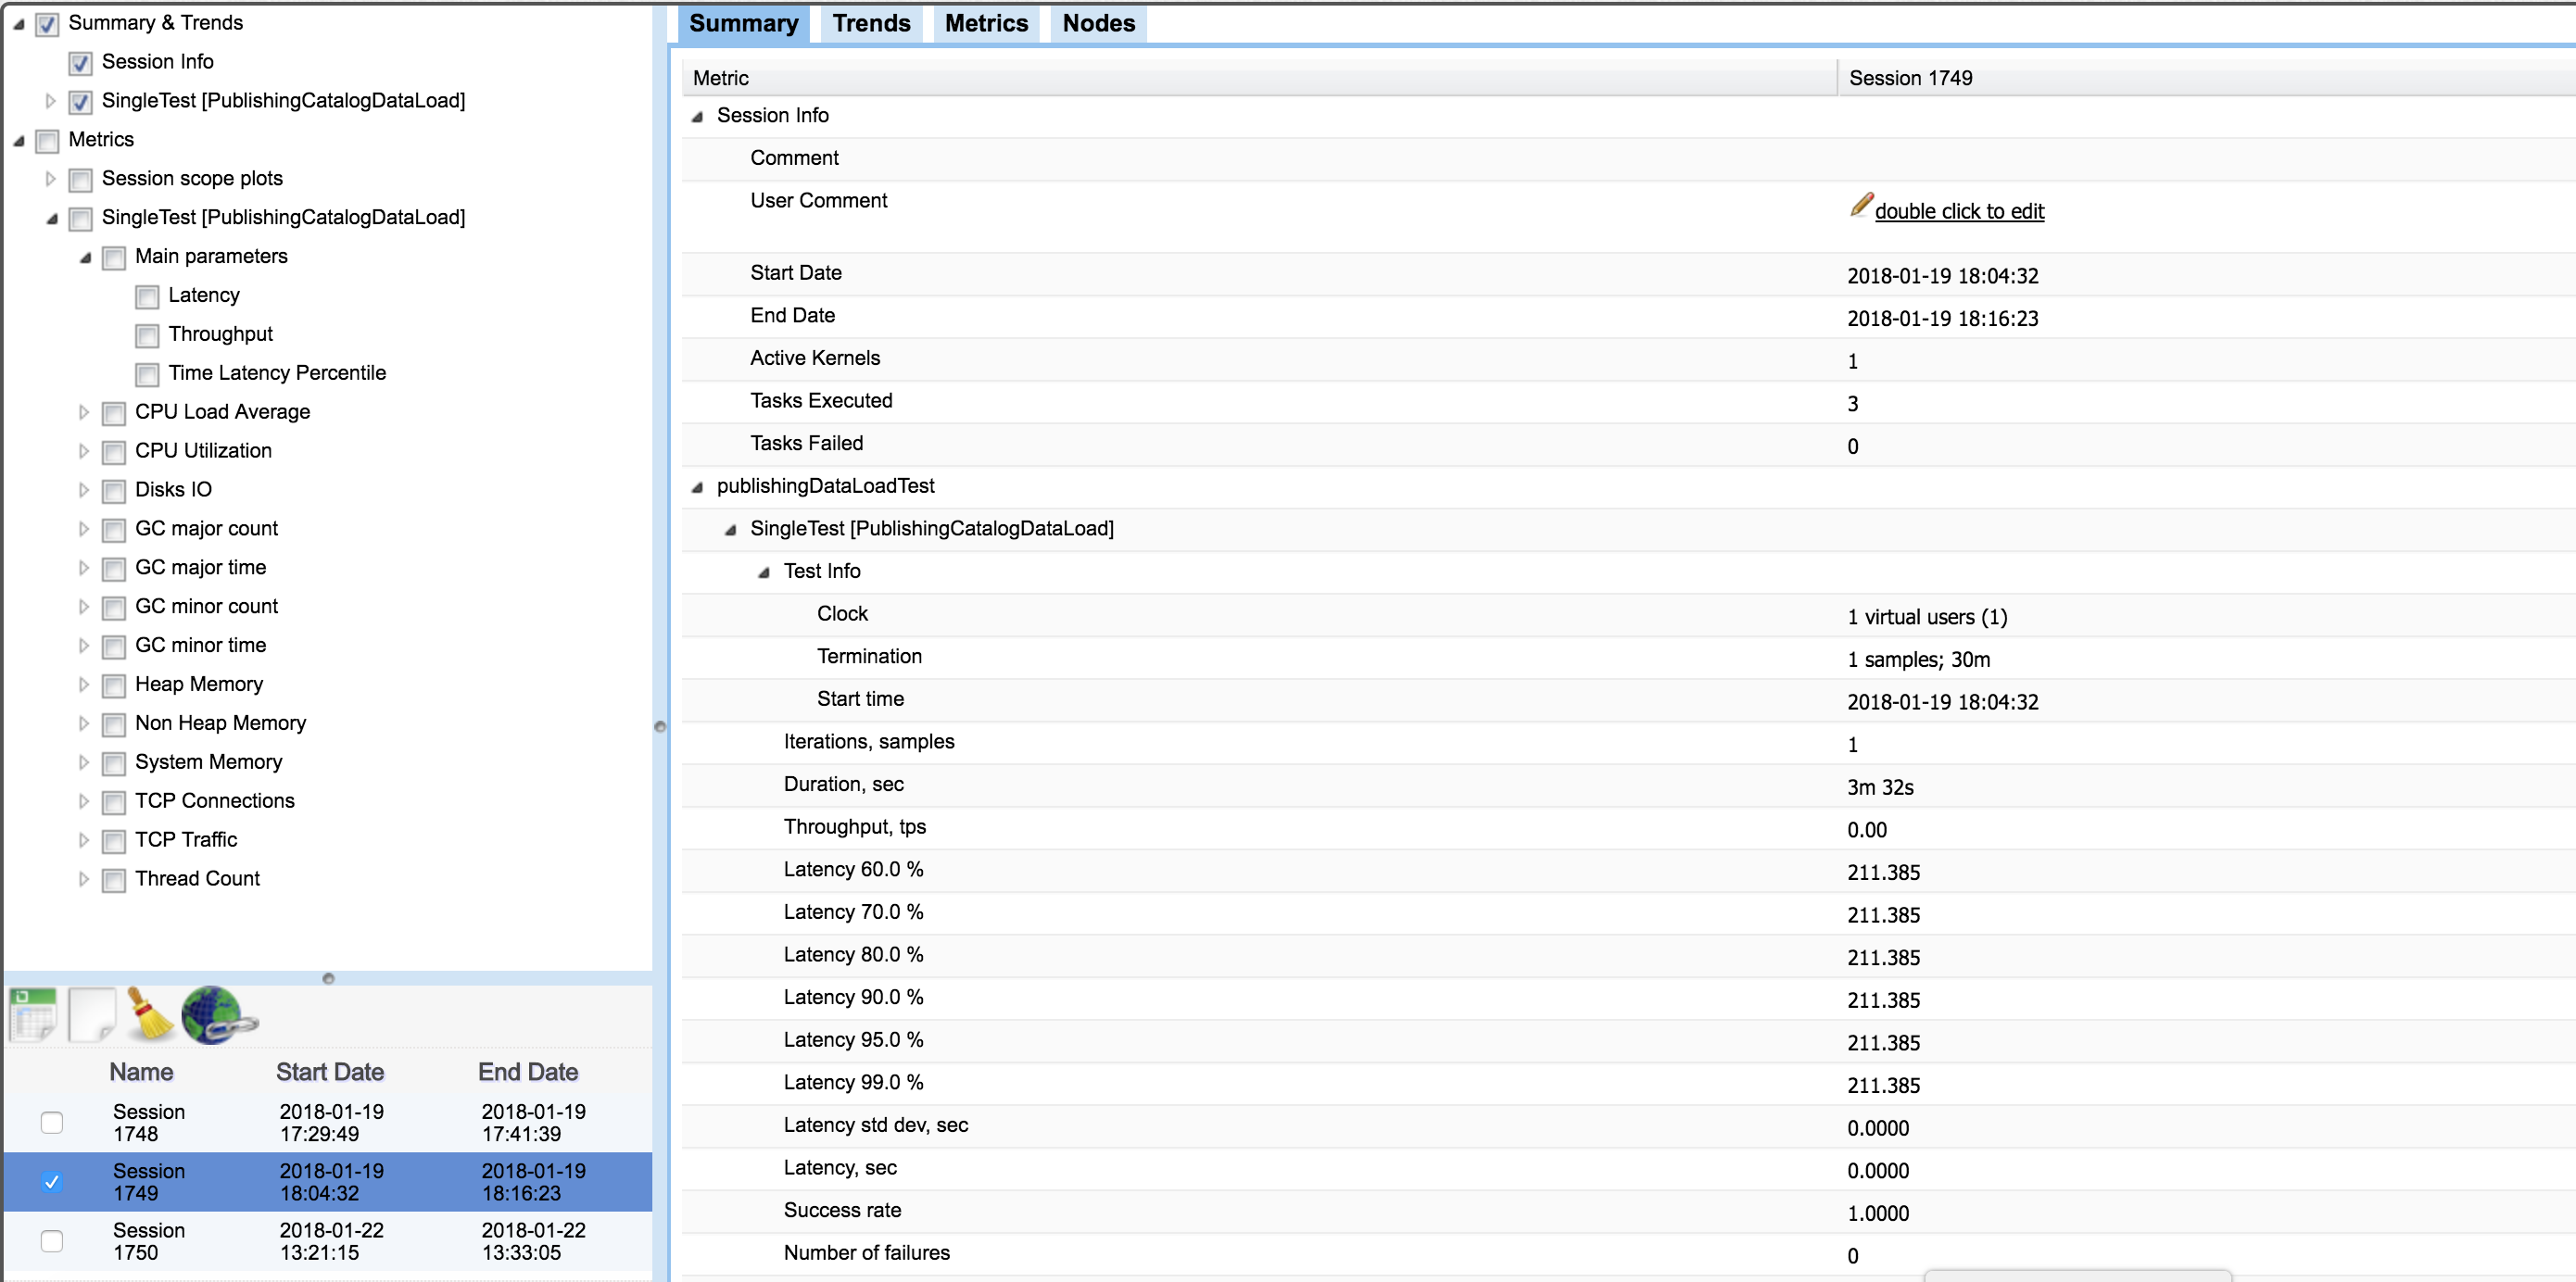
commit 1766c89 there are missing metrics Latency and Throughput on UI and in a database. In jagger version=1.2.5, when we have test with following configuration:
<test id="PublishingCatalogDataLoad" testDescription="publishingDataLoadTest">
                    <load xsi:type="load-invocation" exactcount="1" threads="1" delay="0"/>
                    <termination xsi:type="termination-iterations" iterations="1" maxDuration="30m"/></test>
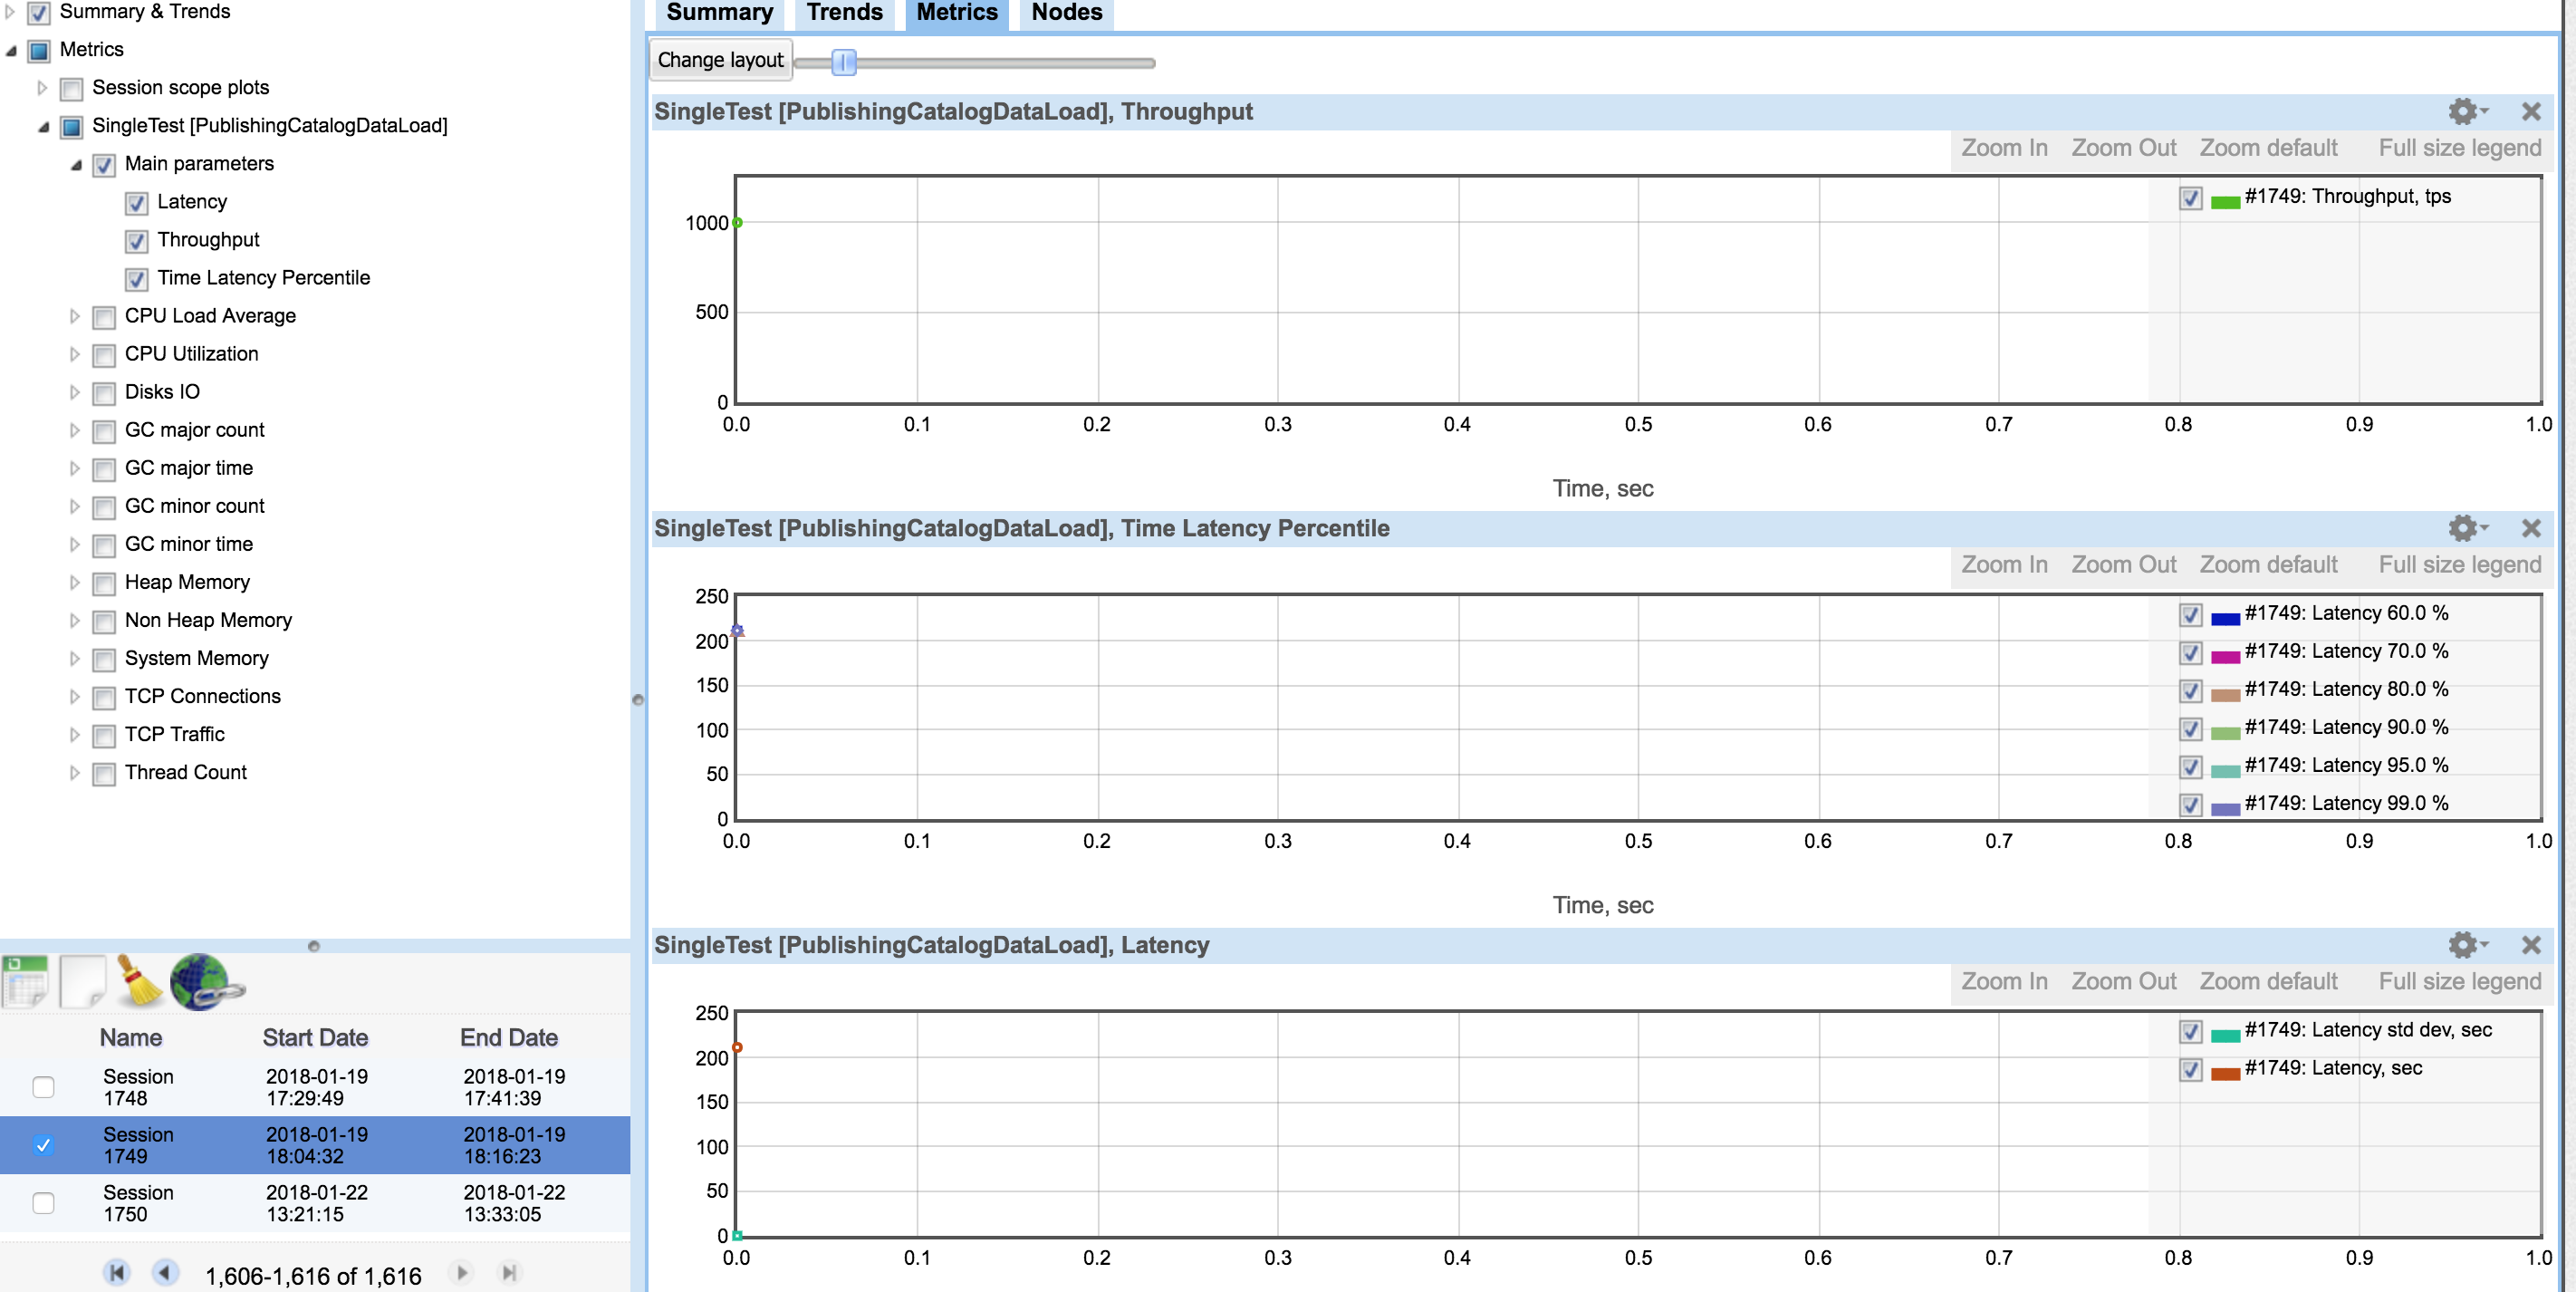
we get metrics representation on UI like this:
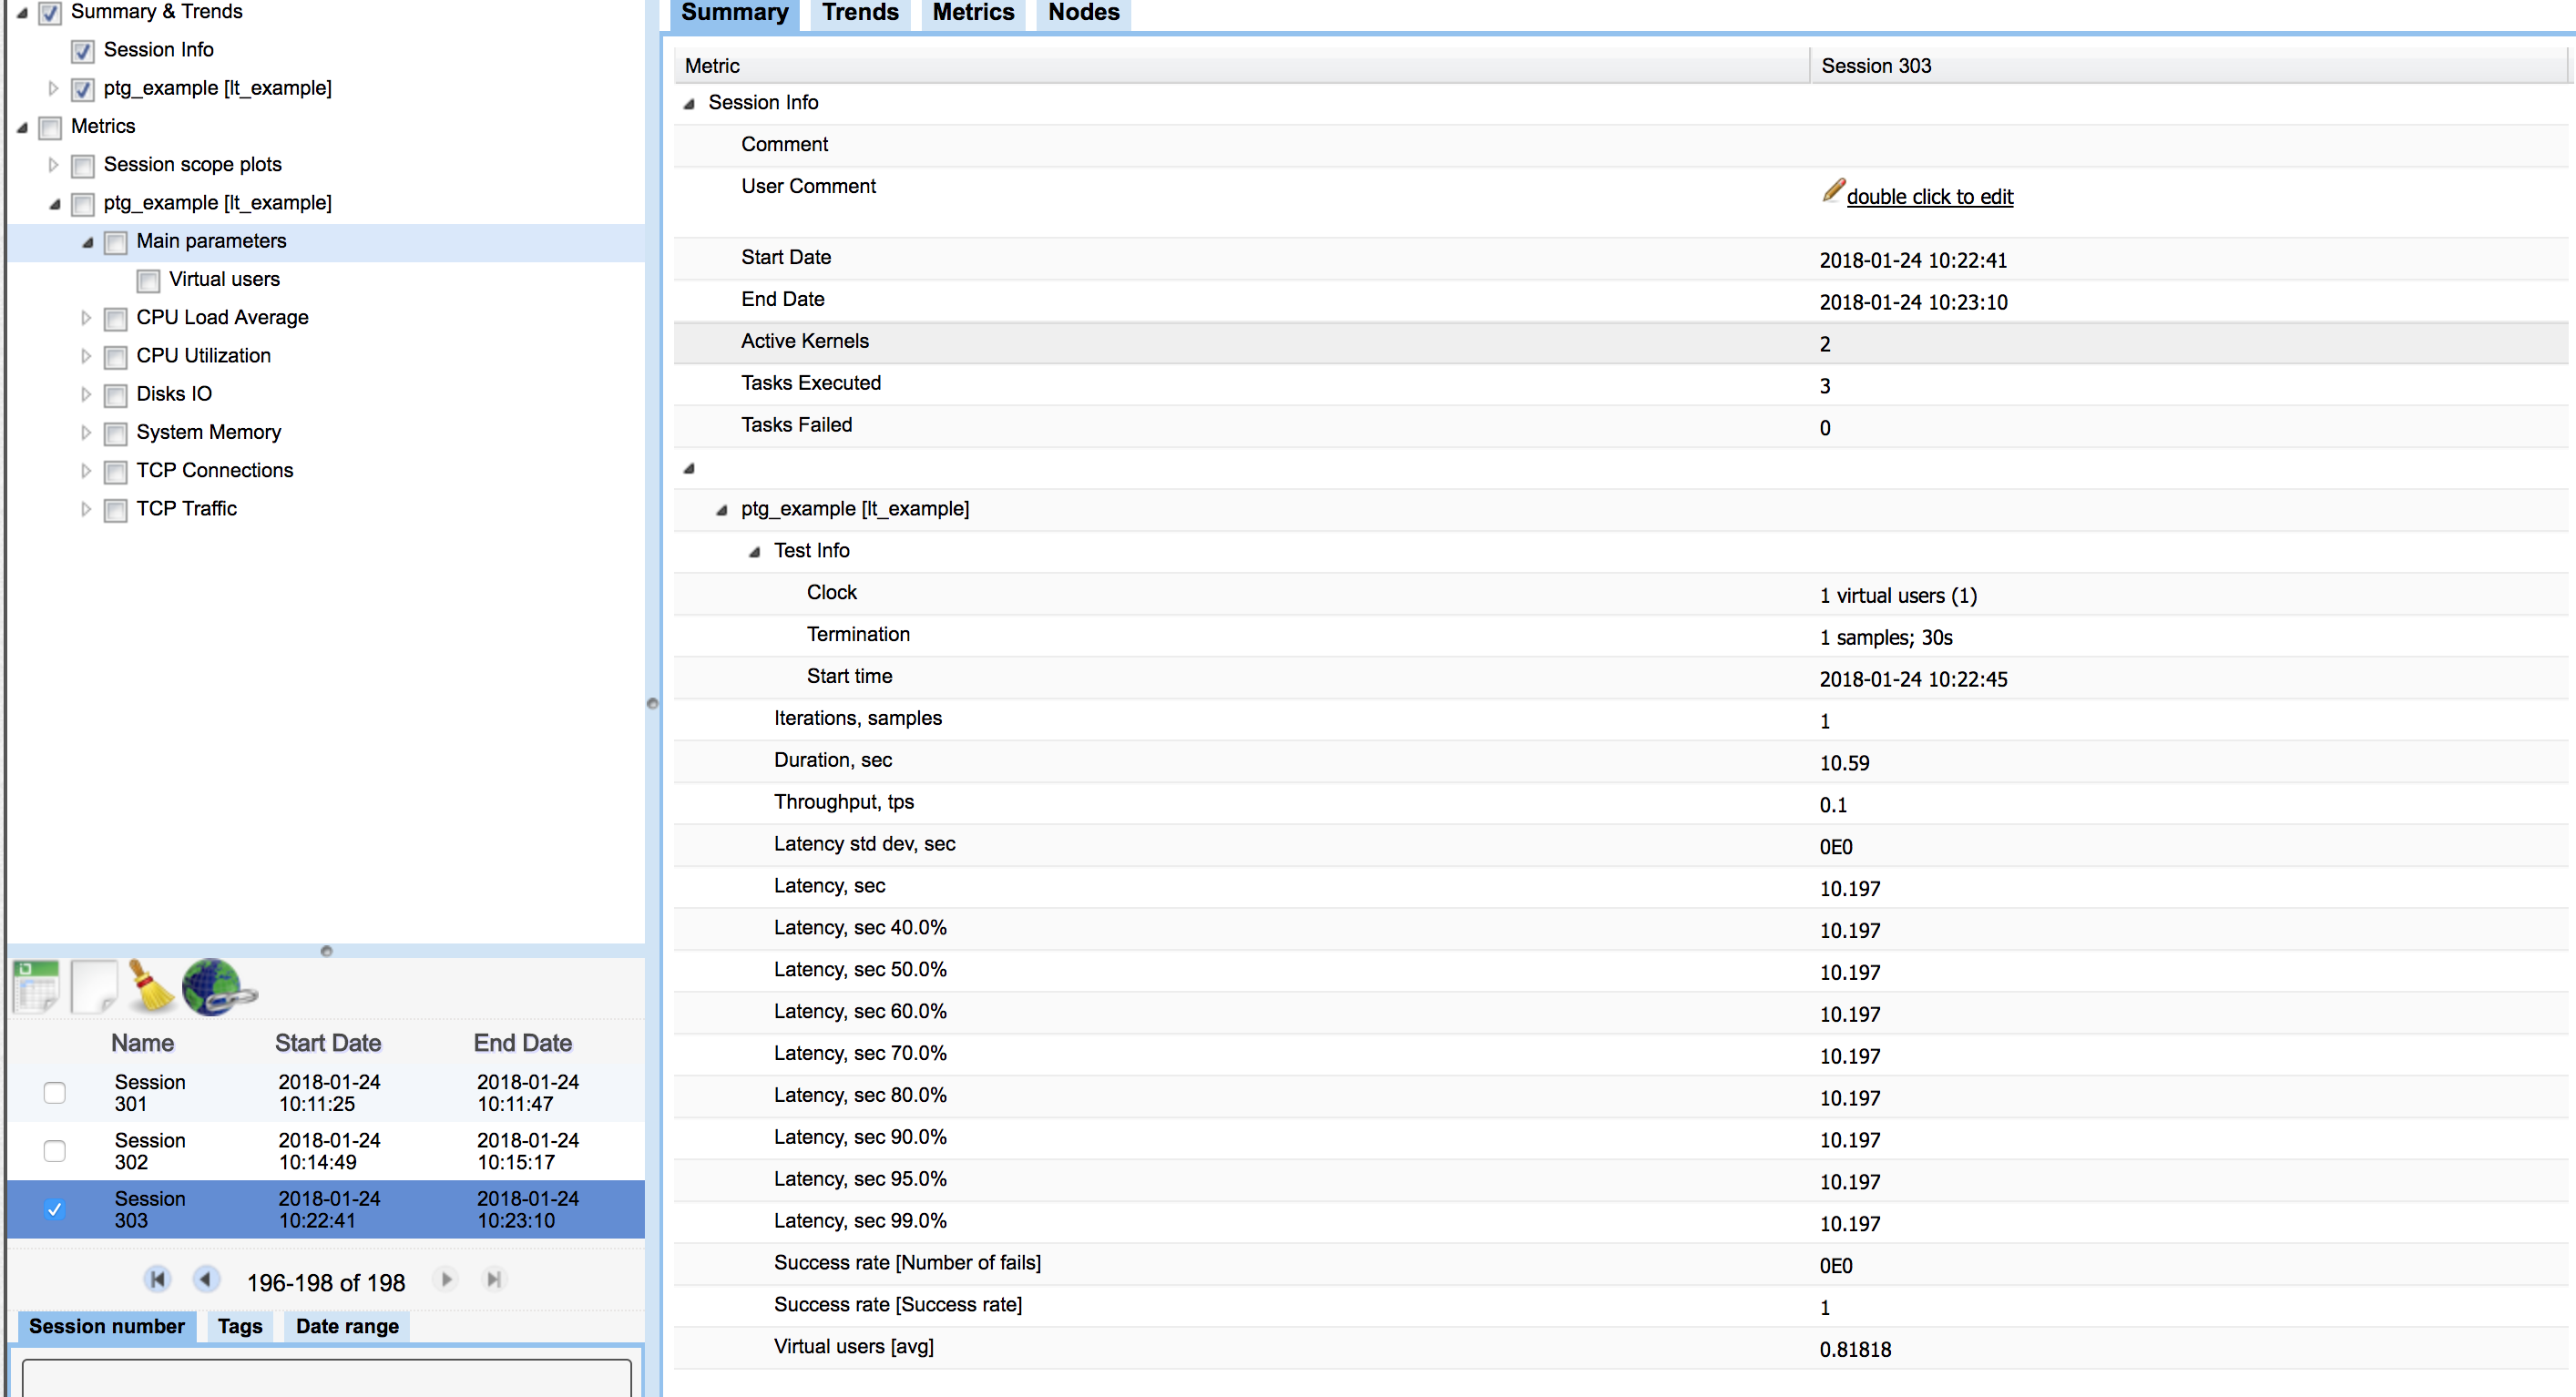
Now it looks like this:
Steps to reproduse:
-
Take the Jagger test example from a class com.macys.platform.ExampleSimpleJLoadScenarioProvider
-
Change these two lines of code:
JLoadProfile jLoadProfileRps = JLoadProfileRps.builder(RequestsPerSecond.of(10)).withMaxLoadThreads(10).withWarmUpTimeInMilliseconds(10000).build();
JTerminationCriteria jTerminationCriteria = JTerminationCriteriaIterations.of(IterationsNumber.of(500), MaxDurationInSeconds.of(30));
to
JLoadProfile jLoadProfileRps = JLoadProfileInvocation.builder(InvocationCount.of(1), ThreadCount.of(1)).build();
JTerminationCriteria jTerminationCriteria = JTerminationCriteriaIterations.of(IterationsNumber.of(1), MaxDurationInSeconds.of(30));
-
Launch 'ls_example' test in distributed or local mode
-
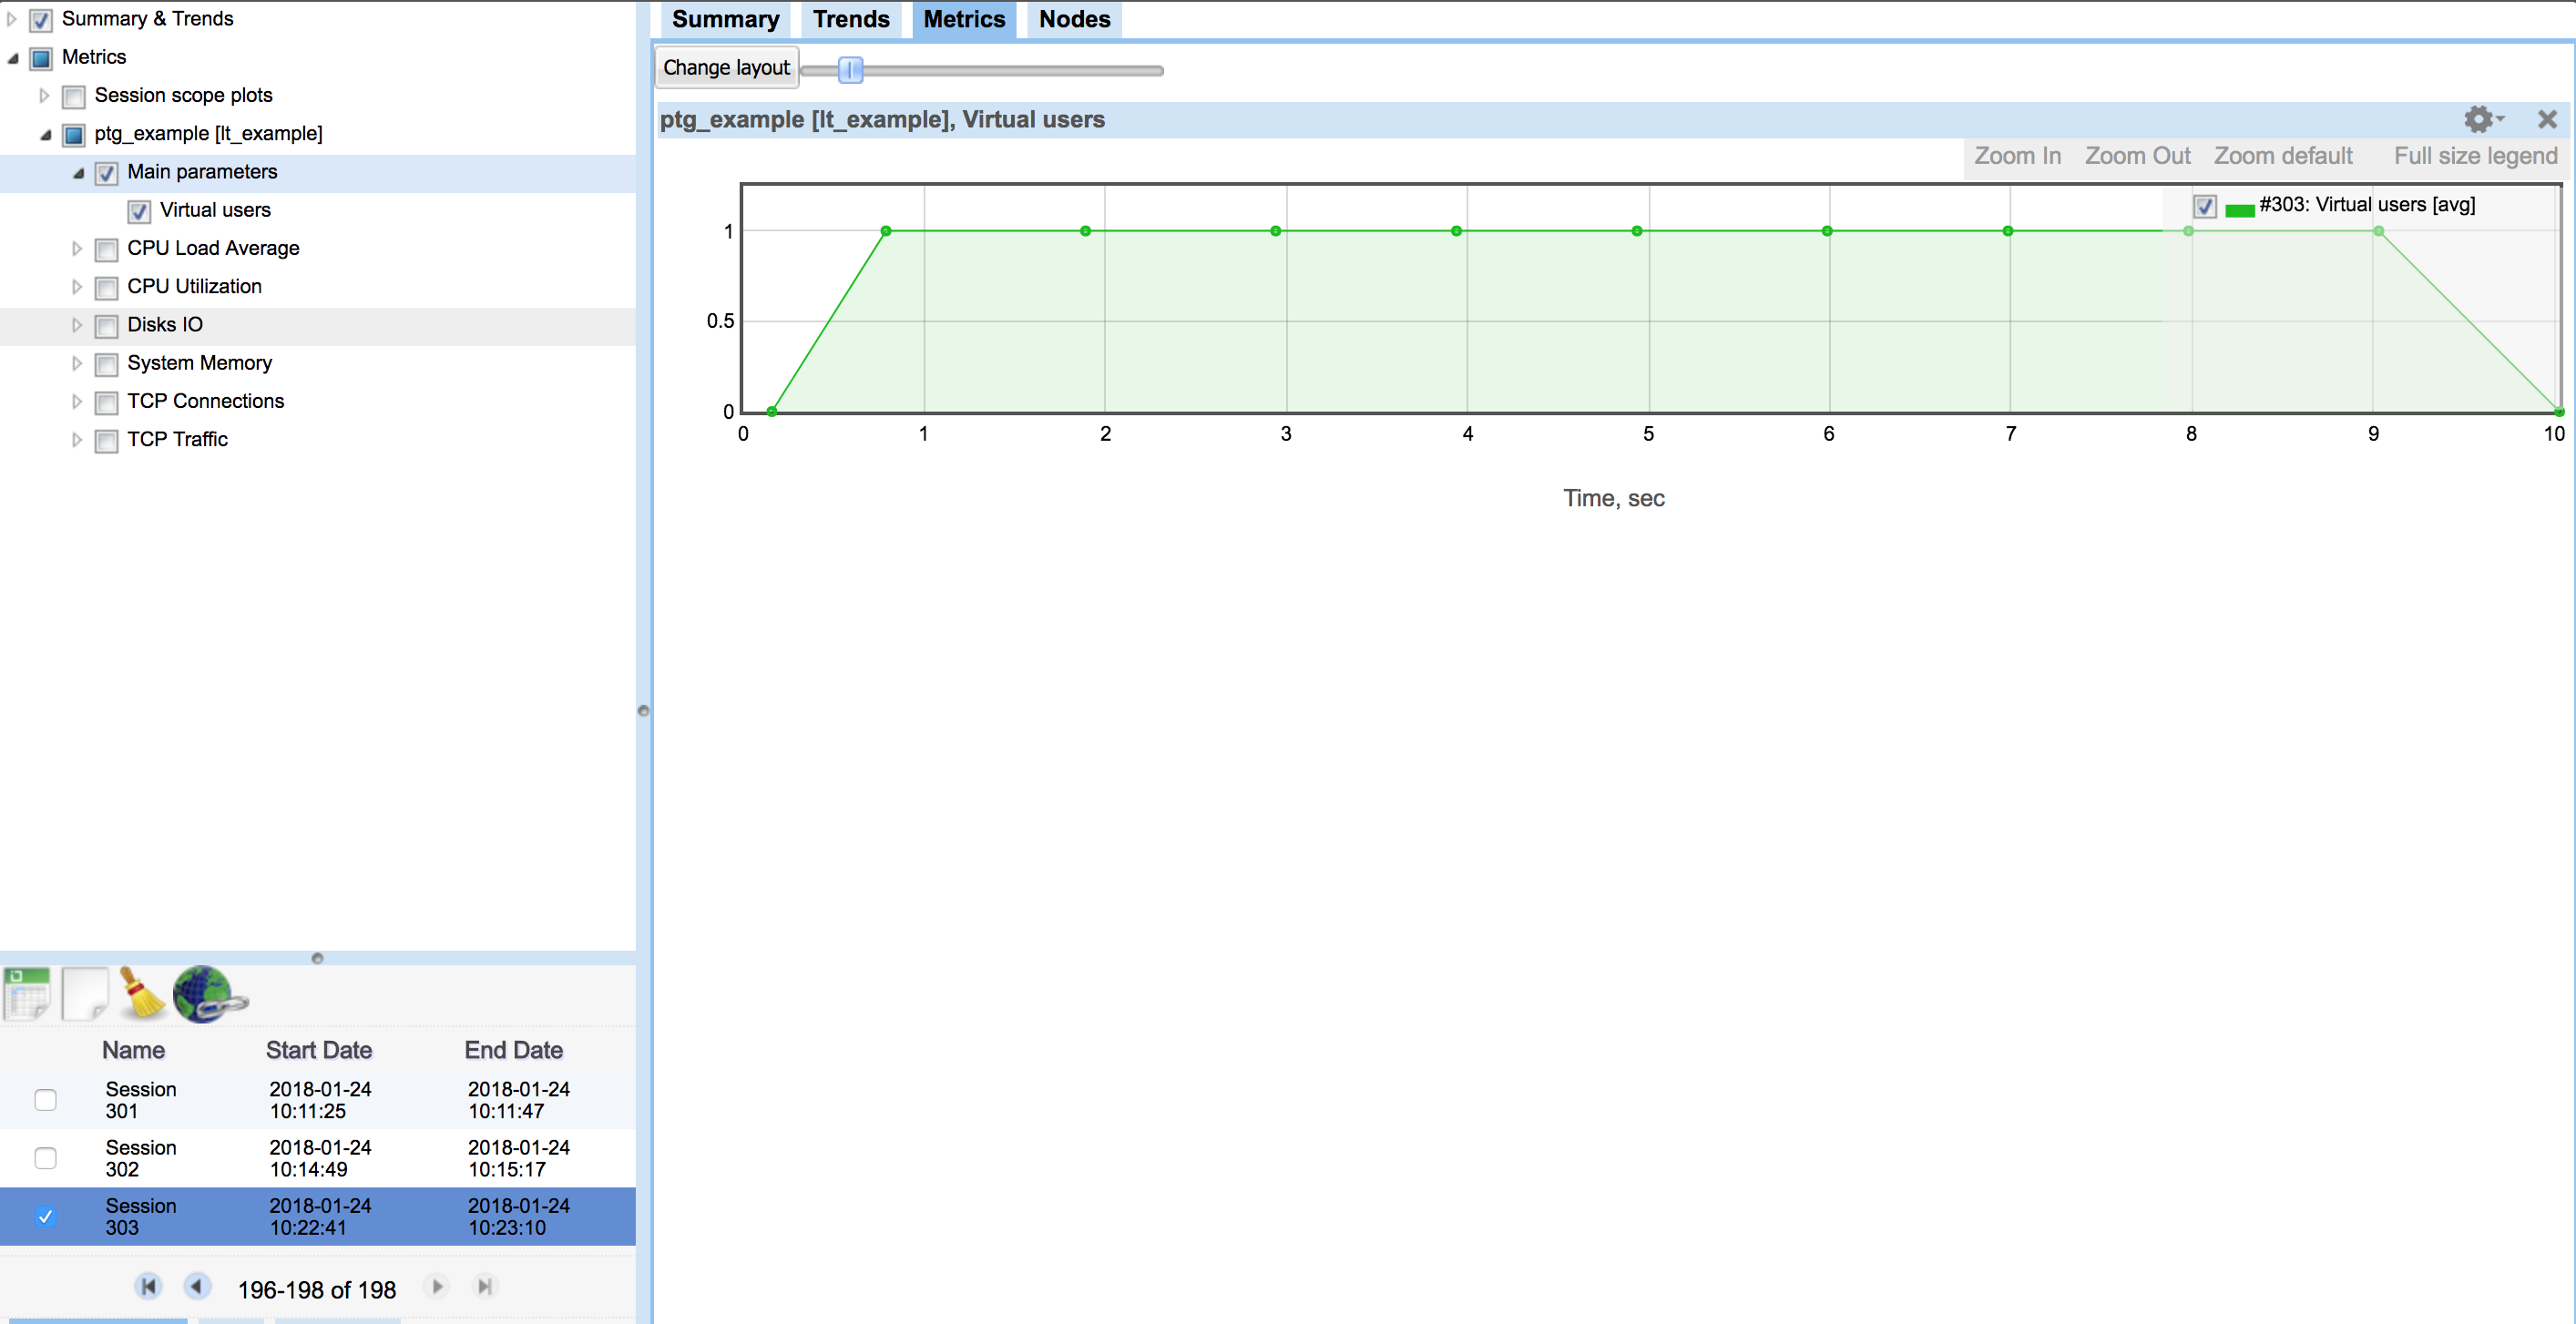
Go to jagger UI http://localhost:8087/ and see Metrics ---> ptg_example[lt_example] ---> Main parameters