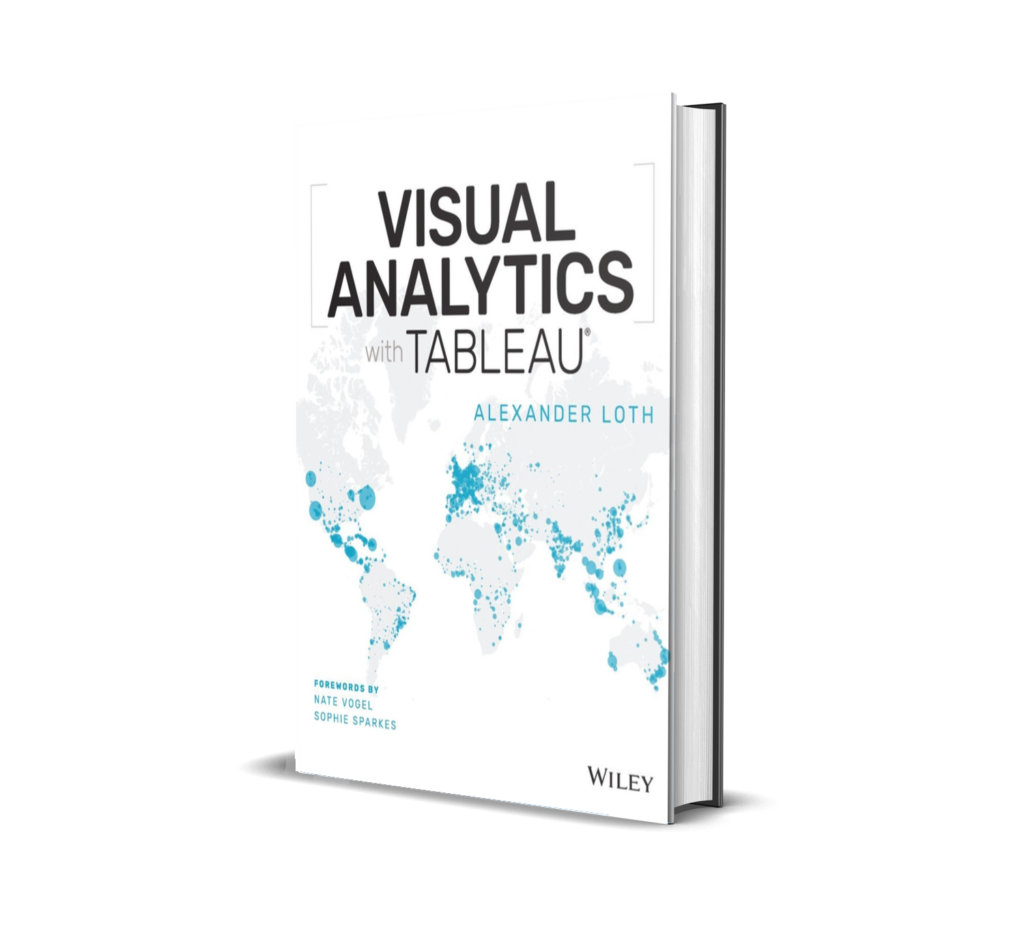
Official companion repository for Visual Analytics with Tableau by Alexander Loth (Wiley). This repo contains the Tableau Workbooks (
.twbx) and Tableau Prep flows (.tfl) used throughout the book so you can follow along, experiment, and adapt the examples to your own data.
Buy the book: Wiley · Amazon · More info on the companion site
- Business professionals who make data-informed decisions.
- Analysts & developers building dashboards for teams and stakeholders.
- Data scientists doing rapid visual exploration before modeling.
- Anyone with access to data and a desire to understand it—no prior math or coding required.
-
Get Tableau
- Use Tableau Desktop (free trial) or Tableau Public (free).
- Tableau Prep Builder is required for Chapter 10 flows.
-
Download examples
- Click the green
<> Codebutton → Download ZIP. - Unzip and open the
.twbxworkbooks directly in Tableau (they are packaged with data where applicable).
- Click the green
-
Follow along with the book
- Open the matching chapter folder and work through the examples step-by-step.
Tip: If Tableau prompts you to upgrade a workbook created with an older version, accept the upgrade; save under a new filename to keep the originals untouched.
As a reader of the book, you get access to exclusive partner offers designed to enhance your learning experience.
| Chapter | Title | Key Topics |
|---|---|---|
| 🚀 1 | Introduction & Getting Started with Tableau | App suite, UI, data prep basics, first viz, saving & sharing |
| 🔌 2 | Adding Data Sources in Tableau | Connectors, joins, unions, extracts vs. live, metadata |
| 📊 3 | Creating Data Visualizations | Bars, scatter, lines, highlight tables, heatmaps, bullet & waterfall |
| 🧮 4 | Aggregations, Calculations & Parameters | Aggregates, text/date/logical functions, what-if with parameters |
| 📈 5 | Table Calcs & LOD Expressions | Quick calcs, custom (bump), dual-axis, LOD (FIXED / INCLUDE / EXCLUDE) |
| 🗺️ 6 | Maps | Symbol, filled & density maps, layers, dual-axis, Viz in Tooltip, spatial data |
| 🔬 7 | Advanced Analytics | Trend lines, forecasting, clustering, R / Python / MATLAB integration |
| 🎨 8 | Interactive Dashboards | Layout, containers, filter / highlight / URL actions |
| 🌐 9 | Sharing Insights | Publish to Online / Server / Public, Ask Data, Mobile, embedding |
| 🛠️ 10 | Data Prep with Tableau Prep | Connect, clean, split, group, join, output flows |
Why no folders for Chapters 2 & 9? These chapters are concept-focused and don’t produce standalone workbooks.
First-Visualization.twbx– Build your first bar chart (Sales by Category) with Profit on color.
Bar-Chart-Example.twbx– Basic bar chart with color encoding for Profit.Waterfall-Chart.twbx– Cumulative Sales by Sub-Category (pages 73–77 in the book).
Calculated-Field-Profit-Ratio.twbx– Sales & Profit margin calculation (cf. Figure 4.4).Searchable-Customer-List.twbx– Parameter-driven text search (pages 100–103).
Bump-Chart.twbx– Visualize ranking changes over time with a dual axis.Adjustable-Moving-Average.twbx– Moving average with a tunable window parameter.
Symbol-Map-Sales-Profit.twbx– City-level map; size = Sales, color = Profit.Undersea-Cables-Map.twbx– Spatial-data example using undersea cable geometry (pages 148–152).
Trend-Line-Example.twbx– Polynomial trend line with confidence bands.Customer-Segmentation-Clusters.twbx– K‑means–style clustering on Sales & Profit.
Sales-Dashboard.twbx– Interactive dashboard with filter, highlight, and URL actions.
Superstore-Prep-Flow.tfl– End‑to‑end cleaning/shaping/joining in Tableau Prep.
Do I need the book to use these files? You’ll get the most value pairing the workbooks with the book’s walkthroughs. The files are still useful as standalone references.
Which Tableau version is required?
Workbooks are packaged (.twbx) and generally open in current Tableau versions. If Tableau asks to upgrade the file, proceed and save a copy.
Where’s the data?
Most .twbx files are packaged with data (e.g., Sample – Superstore). If a workbook references an external file, Tableau will prompt you to locate it.
Can I use Tableau Public? Yes—most examples open in Tableau Public. Features that require Desktop/Prep are noted in the book.
Why are there no folders for Chapters 2 and 9? They’re conceptual and focus on process (connecting/publishing), not on discrete workbooks.
- Broken file paths / missing data → When prompted, point Tableau to the correct data location; then Extract → Refresh and save.
- Locale or date format issues → Check Data Source settings and field types after opening; adjust date parsing if needed.
- Performance → If a workbook feels slow, reduce mark count (filters), switch to extracts, or aggregate to a higher level.
If you reference the book or materials, please use the following BibTeX entry to cite the book:
@book{loth_2019_visual,
	title        = {Visual Analytics with Tableau},
	author       = {Loth, Alexander},
	year         = {2019},
	publisher    = {John Wiley \& Sons},
	isbn         = {978-1-119-56020-3},
	url          = {https://alexloth.com/tableau-book/}
}
You can also link the companion site: https://alexloth.com/tableau-book/.
Contributions that enhance the learning experience are welcome! Open an issue for bugs or suggestions.
Alexander Loth is a Data Scientist and Digital Strategist with over 15 years of experience in AI, Data & Cloud.
His career began at CERN and includes leadership roles at Microsoft, Tableau, and SAP. Today, he advises companies and organizations on their digital transformation journeys and is the author of several bestselling books.
This work is licensed under a Creative Commons Attribution 4.0 International License.
Thanks to John Wiley & Sons and the technical editors whose feedback improved the book and examples: Florian Ramseger, Mark Bradbourne, Brahim Salem, and Srilalitha Jammalamadaka. And thanks to the Tableau community for continued inspiration and contributions.
⭐ If these resources help you, consider starring the repo and following the social links above to get updates and share your work!


